This project involved topic modeling, a set of methods for identifying themes in large collections of text, to analyze discussions about social anxiety on Reddit. I compared three approaches to exploratory topic modeling: Latent Dirichlet Allocation (LDA), a traditional probabilistic topic model based on word frequencies, BERTopic which clusters transformer-based text embeddings and TopicGPT which reviews posts using a large language model to generate and assign topics. I analyzed 27,197 posts and 238,589 comments from the r/socialanxiety spanning roughly one year before and one year during the COVID-19 pandemic.
Methods & Tools
Python · Pandas · LDA · BERTopic · TopicGPT · Sentence Transformers · UMAP · K-Means Clustering · Large Language Models (LLMs) · Natural Language Processing (NLP) · Topic Modeling · Text Embeddings · Dimensionality Reduction · Unsupervised Learning · Reddit / Pushshift Data
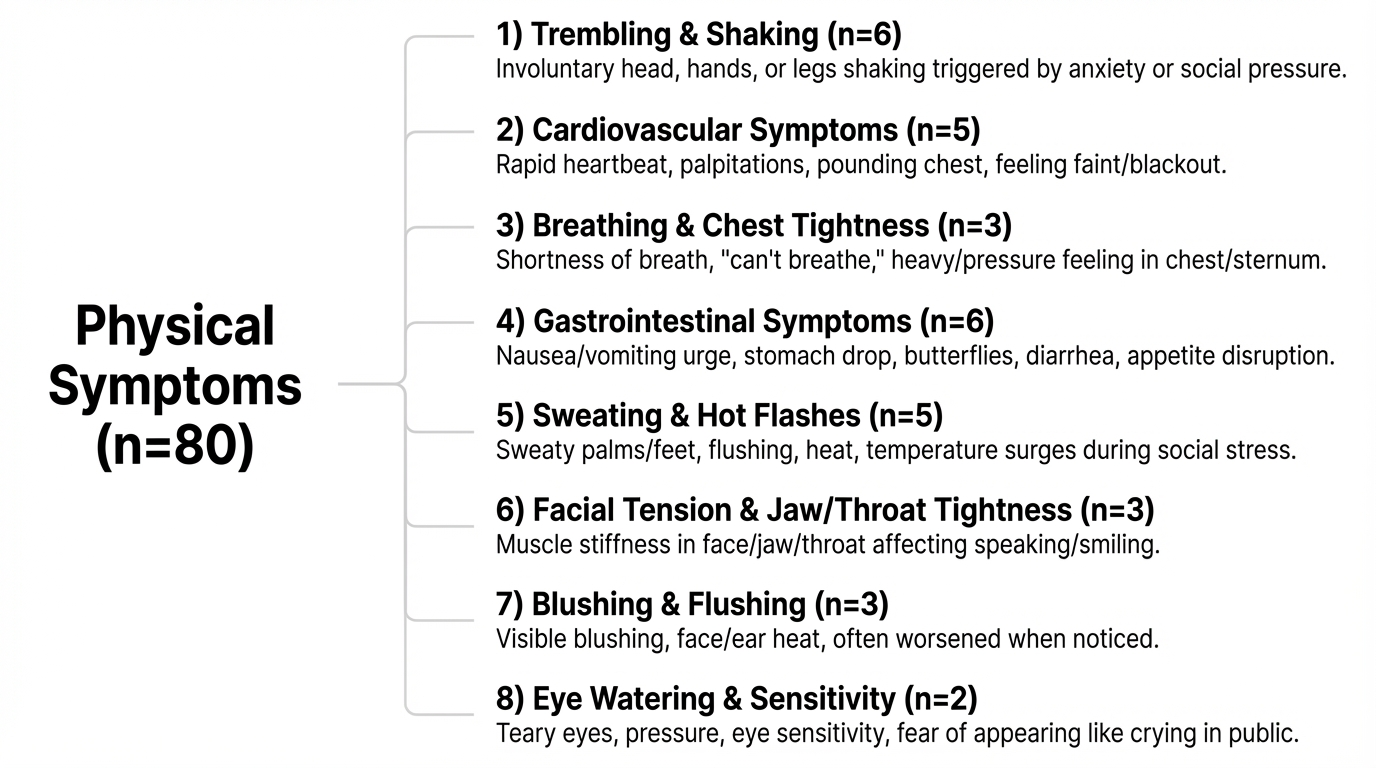
The LDAvis animation shows topic prevalence, similarity between topics and the relative frequency of common words within each topic.The BERTopic animation visualizes the relative positioning and size of 90 topic clusters in the embedding space.TopicGPT’s physical symptoms topic is expanded into eight subtopics, with descriptions and mention counts for symptoms such as trembling, cardiovascular symptoms, breathing difficulties and sweating.
Network Analysis of Conscientiousness:
Latent variable approaches to personality model traits such as conscientiousness as unobservable common causes that elicit patterns across questionnaire responses. Network psychometrics offers an alternative approach, modeling psychological attributes as systems of interconnected components and examining the statistical relationships among them directly.
This project implemented a network analysis of conscientiousness and nine trait-related goals using data from 432 participants. I estimated LASSO-regularized partial correlation networks at the trait, facet and item levels and examined network structure and node centrality. I also used simulation and bootstrap methods to evaluate projected replicability and network stability.
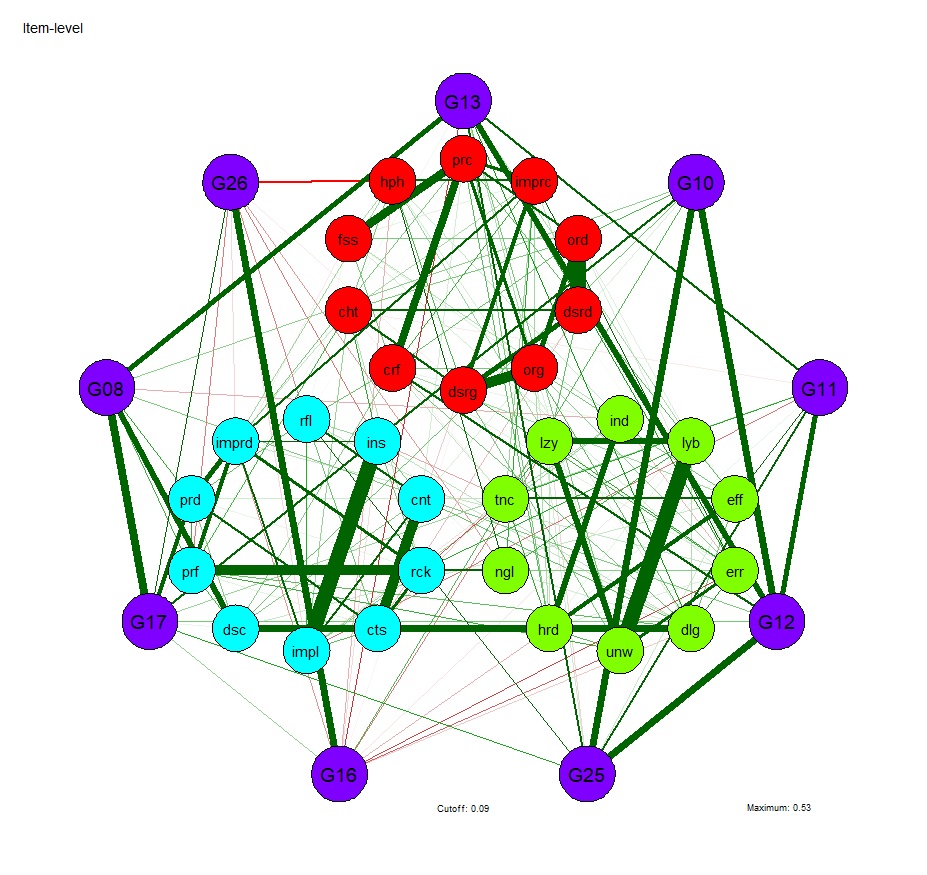
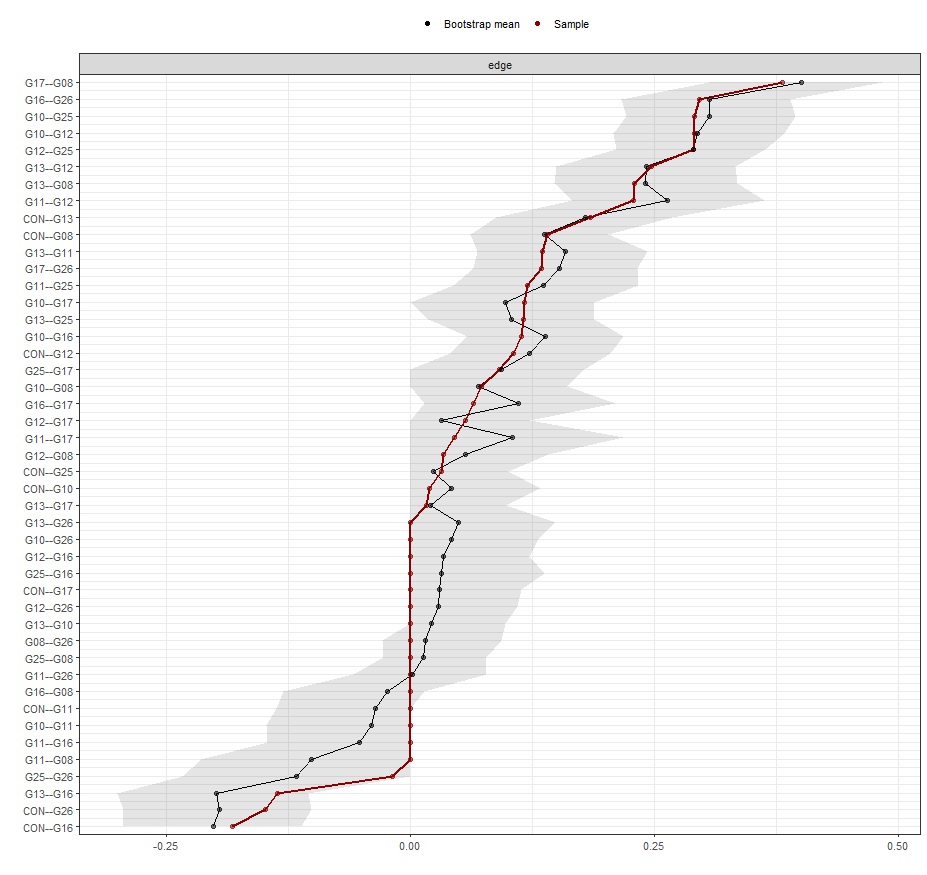
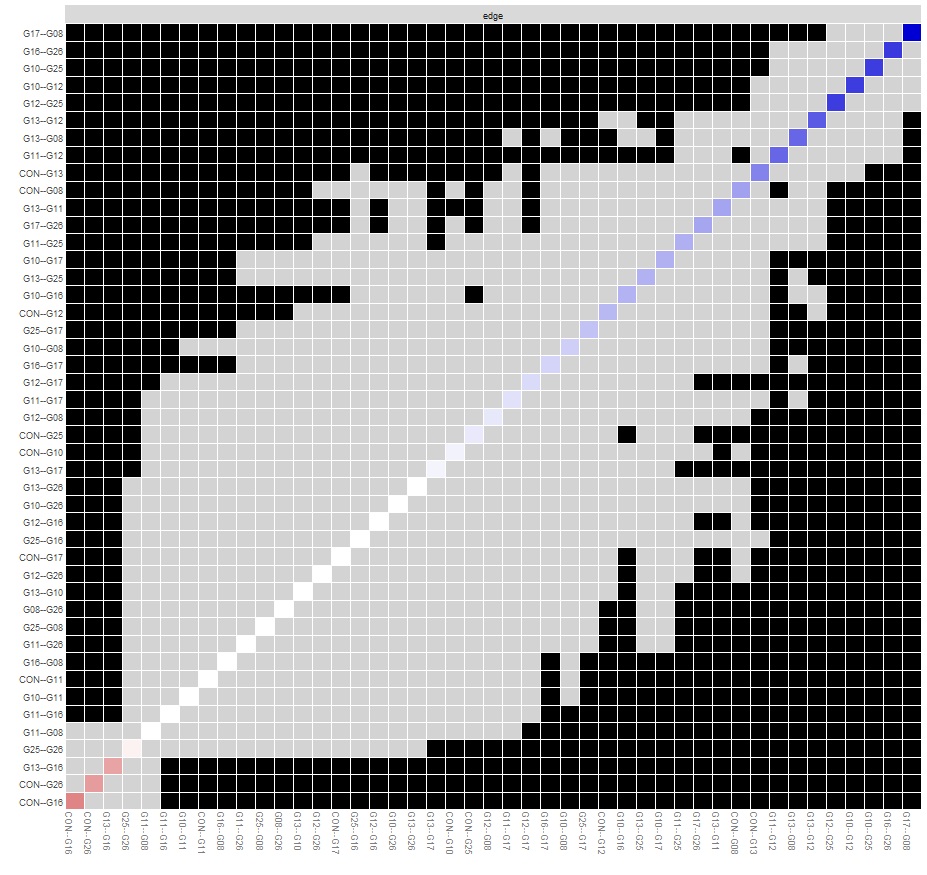
The three figures show the reproduced item-level network, bootstrapped edge-weight confidence intervals and the edge-weight difference test matrix. The second and third figures are for the trait network. Colored nodes represent questionnaire items and goals; green and red edges represent positive and negative partial correlations, while the bootstrap figures summarize uncertainty and significant differences among estimated edges.
Computer-Assisted Diagnosis (CADx) for Brain Tumor Detection :
Medical imaging applications often face constraints in both the availability of labeled training data and access to computational resources. This project implemented a lightweight convolutional neural network for binary brain tumor detection in MRI images designed with these limitations in mind. The project covered image preprocessing, data augmentation, model implementation, training, validation and performance evaluation. I evaluated the model using several classification metrics and discussed its performance, limitations and potential areas for improvement.
Methods & Tools
Python · PyTorch · Torchvision · TorchMetrics · NumPy · Matplotlib · Convolutional Neural Networks (CNNs) · Medical Image Classification · MRI · Data Augmentation · Image Preprocessing · Binary Classification · Model Training & Validation · ROC/AUC Analysis · Precision, Recall & F1 Score
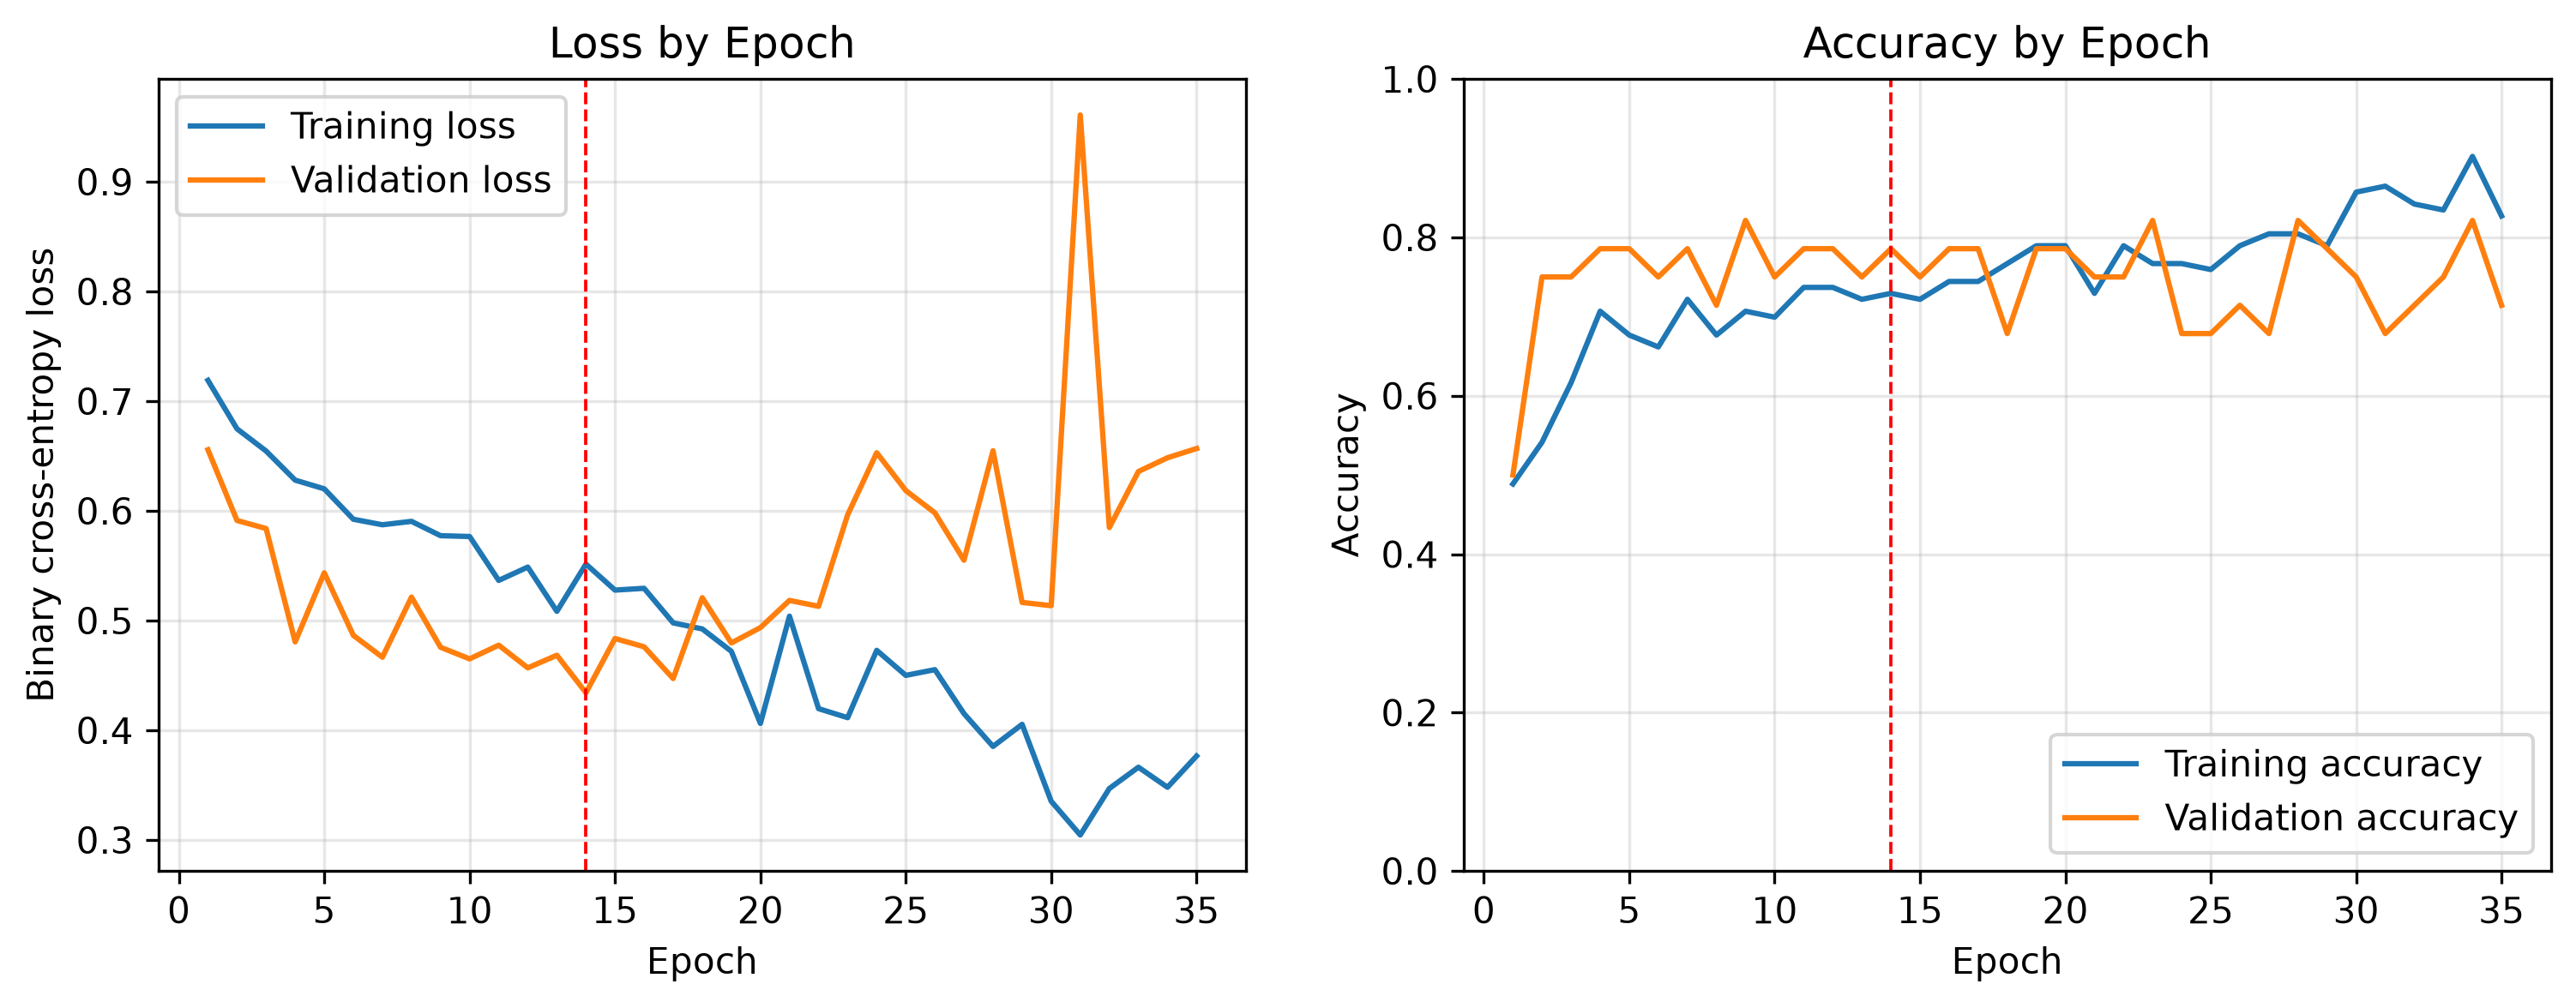
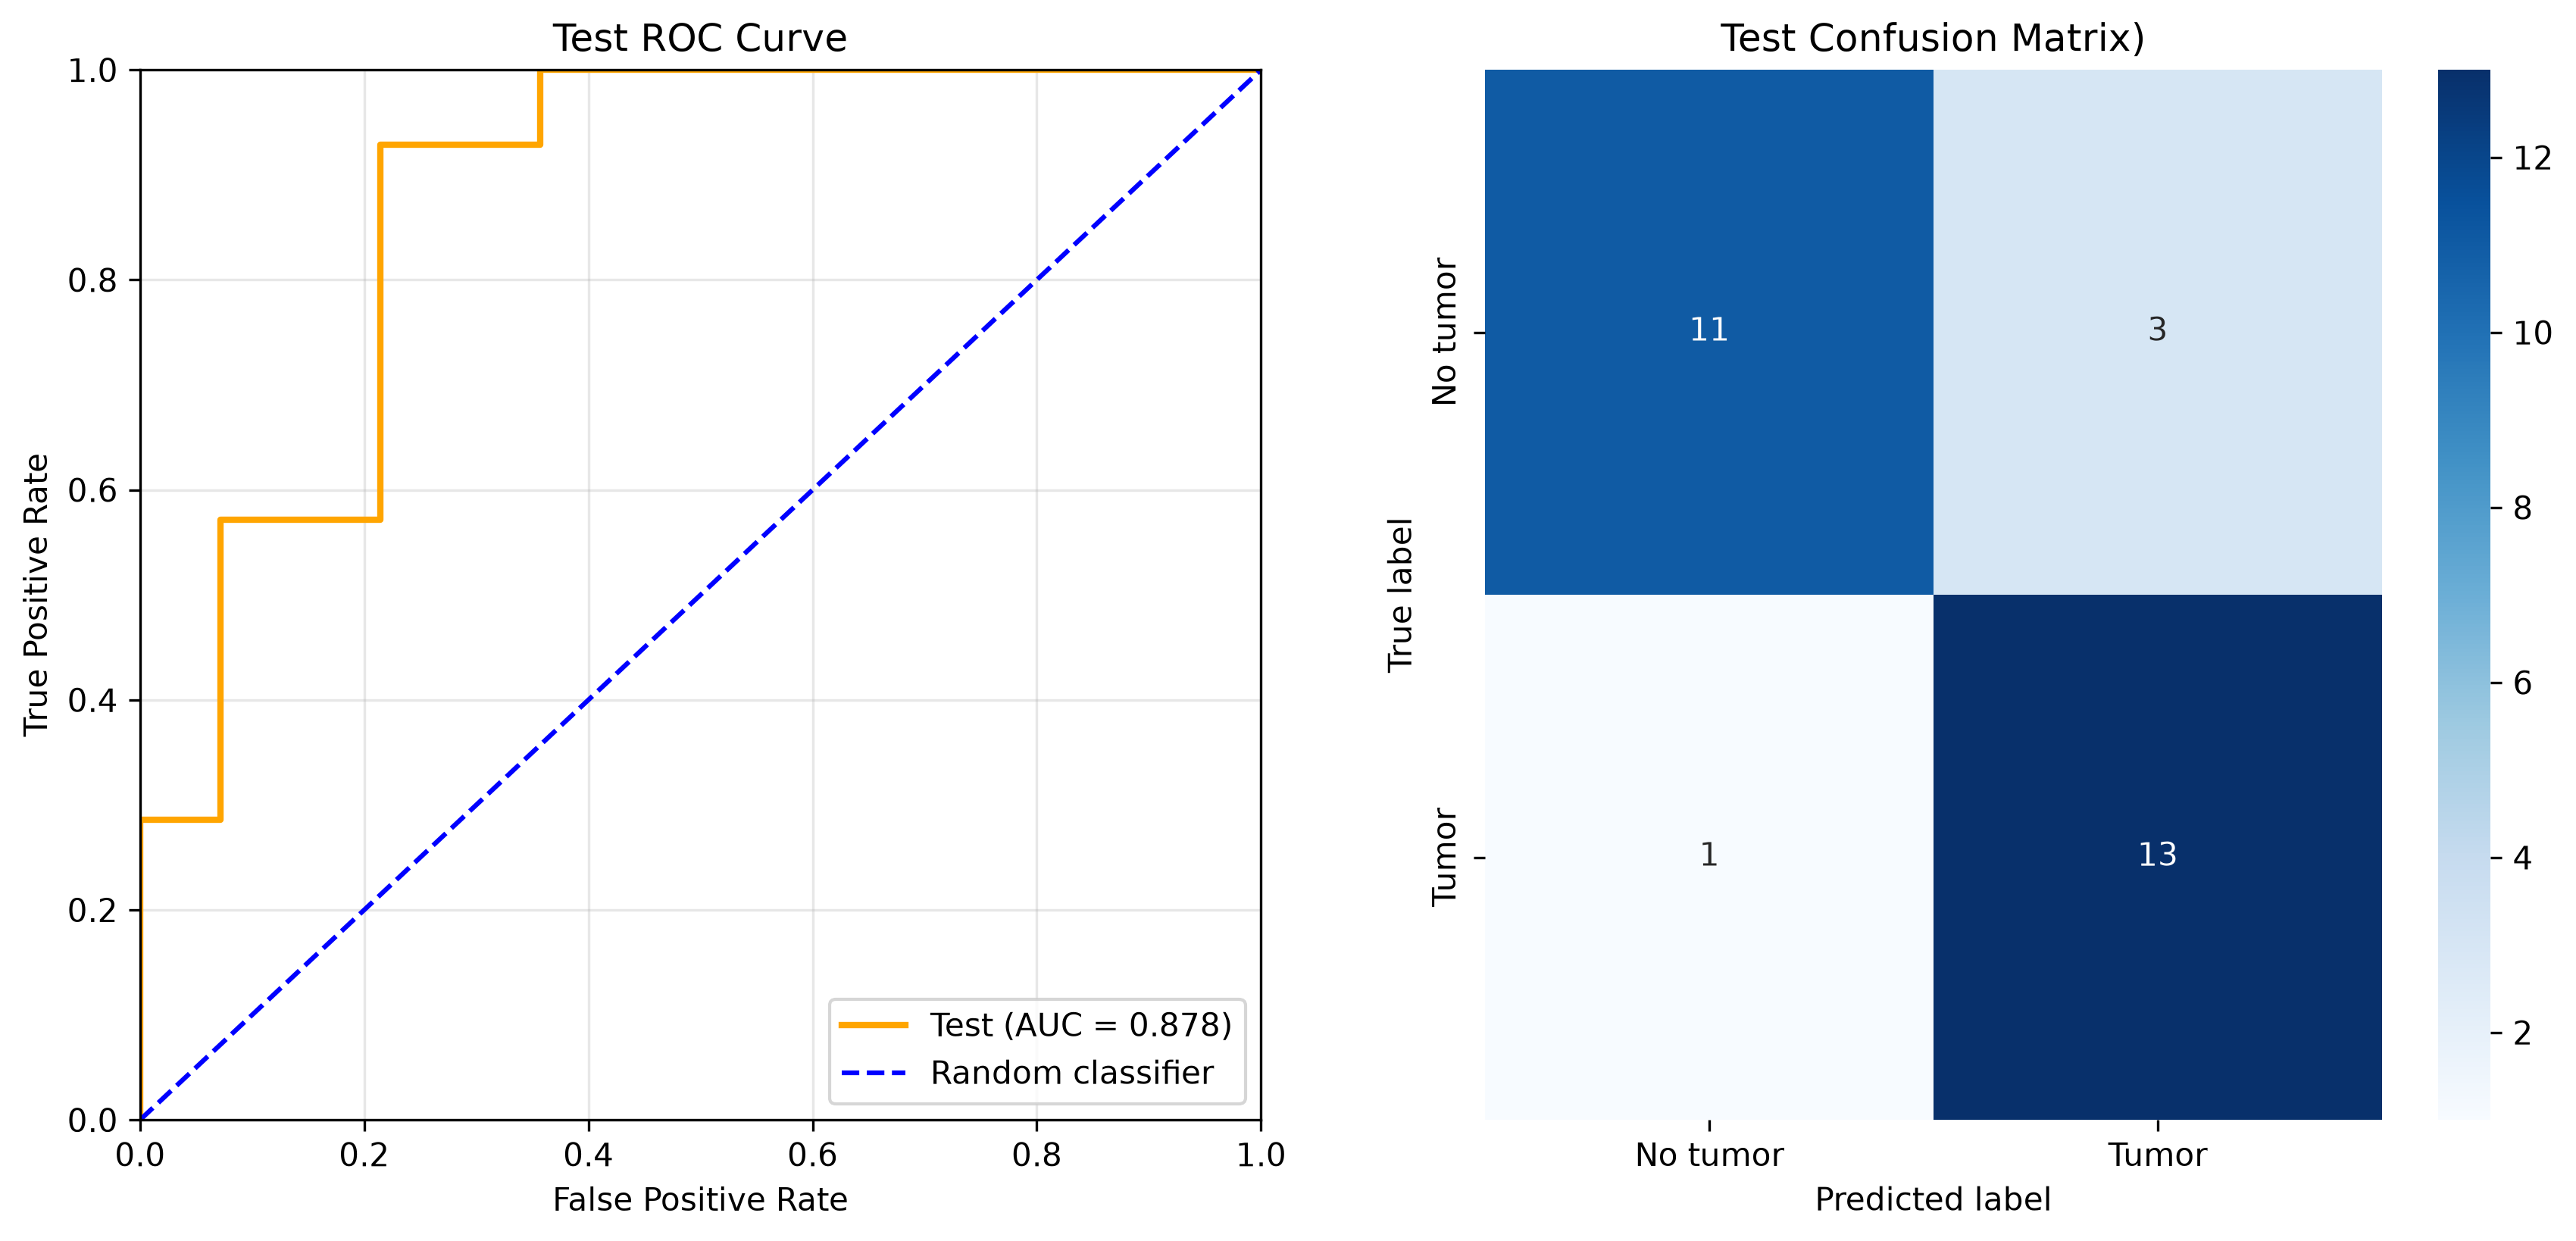
Training and validation loss (left) and accuracy (right) across 35 epochs. The dashed red line marks epoch 14, when the lowest validation loss was recorded and the model checkpoint was saved.Test-set ROC curve and confusion matrix for the saved checkpoint. The ROC-AUC is 0.878; the model correctly classified 24 of 28 test images, with three false positives and one false negative.
Single Cell RNA-Seq analysis of Neuro-Covid:
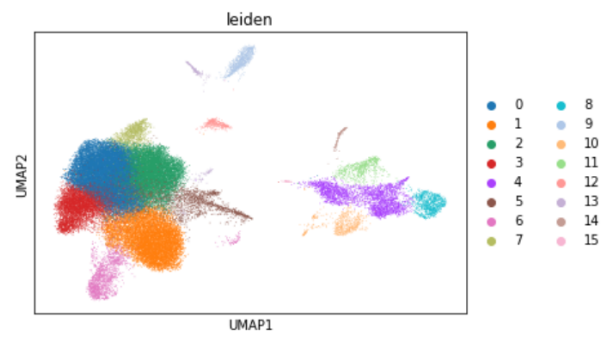
Neurological symptoms can develop in patients with COVID-19, but the mechanisms underlying these effects are still an area of active research. This project analyzed single-cell RNA sequencing data from cerebrospinal fluid (CSF) cells of patients with neurological COVID-19 symptoms and controls. The analysis pipeline includes data cleaning and normalization, feature selection, dimensionality reduction, clustering, visualization and cell-type identification. Expression profiles were generated from over 80,000 individual cells before dimensionality reduction and unsupervised clustering was used to characterize 16 cell populations.